An application example within the USF
Background
In aerodynamic development, wind tunnel and CFD data are typically evaluated using classical coefficient plots: lift, drag, and moment as functions of angle of attack.
This approach is well established and reliable — yet often incomplete.
Critical transitions in system behavior may remain unnoticed as long as the curves appear smooth and well-behaved. In practice, performance losses, instabilities, or discrepancies between simulation and experiment often become visible only at a later stage.
The analysis presented here demonstrates how additional insight can be extracted from the same standard data, without introducing new measurements or assumptions.
Data Basis
The evaluation is based on a public NASA reference dataset representing a generic wing-body-tail configuration in the transonic regime.
• Mach number: approx. 0.85
• Reynolds number: approx. 5 million
• Angle of attack variation
• Integral aerodynamic coefficients:
• Lift coefficient (CL)
• Drag coefficient (CD)
• Pitching moment coefficient (CM)
The dataset does not represent a specific aircraft design. It is a neutral benchmark configuration commonly used for CFD validation and methodological comparison.
Methodological Approach
The USF-based evaluation does not focus solely on absolute coefficient values.
Instead, it analyzes the response behavior of the system along an increasing load path.
In addition to classical plots, the following aspects are examined:
• rate of change of aerodynamic coefficients with increasing angle of attack
• aerodynamic efficiency (L/D)
• cost-to-benefit relationships (e.g. drag increase per additional lift)
This perspective highlights how the system reacts to additional loading — not just what values it produces.
Results (Summary)
The analysis reveals a distinct transition region at approximately 2.5–3.0 degrees angle of attack:
• Aerodynamic efficiency reaches a maximum and decreases noticeably beyond this point.
• Drag increases disproportionately relative to additional lift.
• The pitching moment response changes its characteristic behavior.
Notably, these effects are not obvious in the classical coefficient plots, even though they indicate a qualitative change in system behavior.
Interpretation
The analysis does not claim stall onset or a specific flow mechanism.
Instead, it identifies a regime or state transition in the aerodynamic response of the system.
Such transitions are highly relevant for:
• aerodynamic design margins
• comparison of wind tunnel runs
• CFD validation and consistency checks
• early detection of efficiency loss or operational risk
Importantly, this added insight is obtained without additional sensors or measurement complexity — solely through structured interpretation of existing data.
Context within the USF
This example illustrates a concrete application of the USF methodology:
• emphasis on relationships rather than isolated values
• focus on transitions instead of end states
• early identification of structural changes in system behavior
The analysis is intentionally conservative and domain-specific.
However, the underlying USF principles are system-agnostic and transferable to other technical, data-driven, and dynamic systems.
Conclusion
Structured analysis of aerodynamic data enables earlier and more reliable understanding of system behavior — using the same data already available today.
Not more measurement.
Better reading.
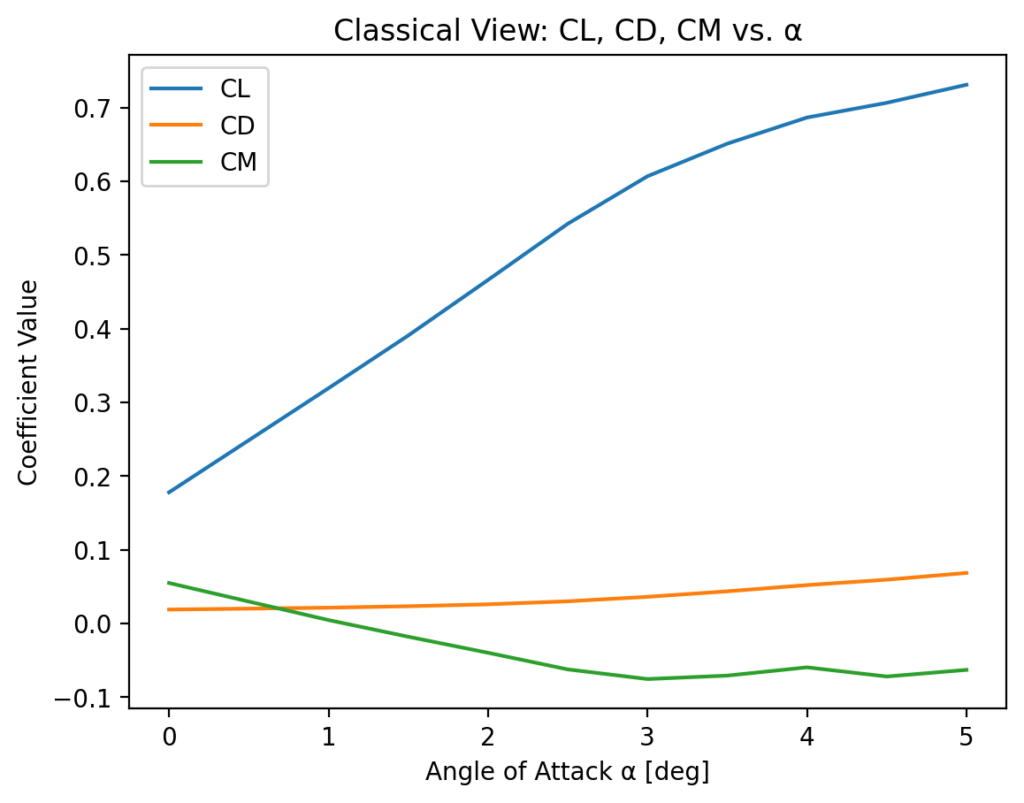
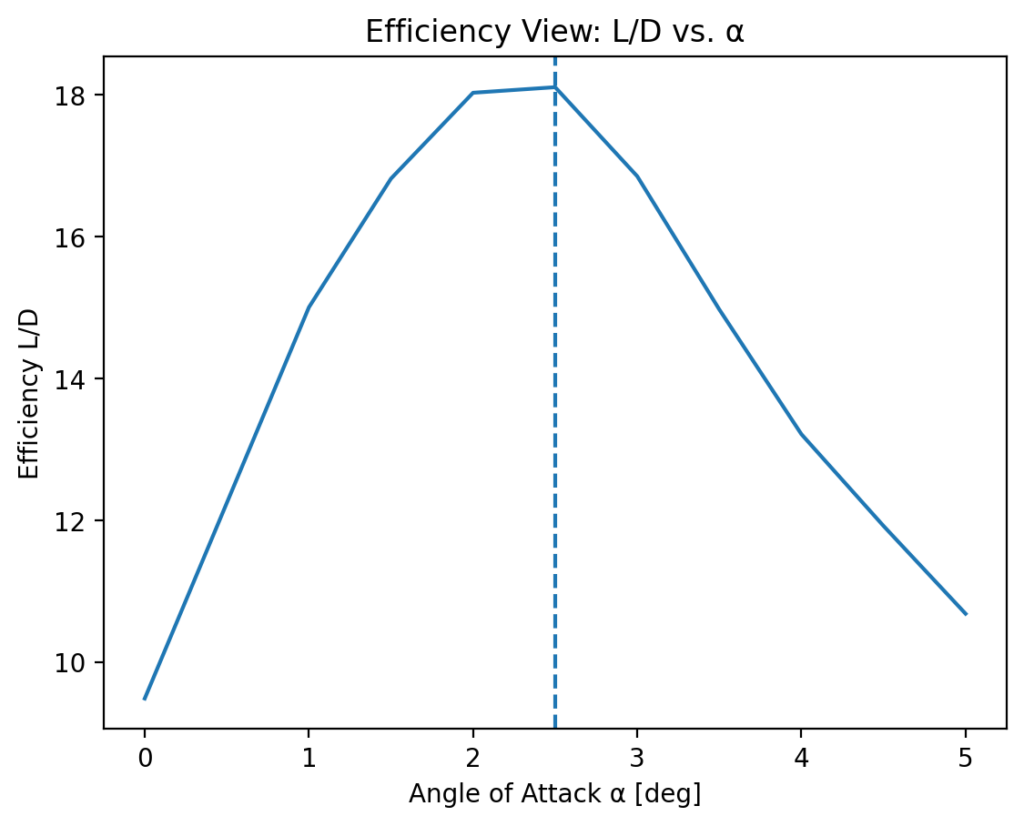
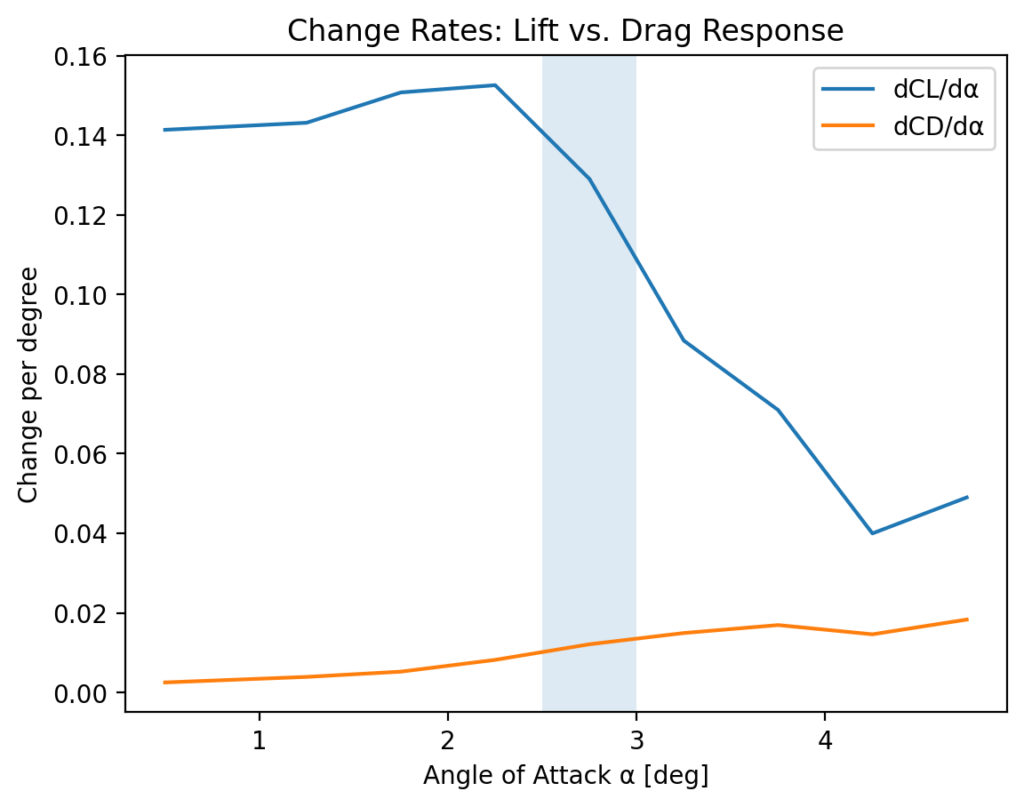
Figure 1 – Classical View
CL, CD, and CM vs. angle of attack
What is shown:
The lift, drag, and pitching moment coefficients exhibit smooth, continuous trends over the angle of attack. Standard aerodynamic quantities and a well-behaved dataset, without hidden processing or artificial enhancement.
Figure 2 – Efficiency View
Lift-to-drag ratio (L/D) vs. angle of attack
What is shown:
A clear efficiency maximum occurs at approximately 2.5° angle of attack.
Interpretation:
Beyond this point, further increases in angle of attack yield diminishing returns: additional lift is achieved at a disproportionately higher drag cost.
Figure 3 – Change Rates, Making the Transition Visible
Change rates and cost of lift increase
The derivatives dCL/dα and dCD/dα plotted together.
A pronounced increase occurs in the range of approximately 2.5–3.0° angle of attack, indicating a qualitative change in system response.
Interpretation:
This behavior reflects a regime or state transition in the aerodynamic response, even though the raw coefficient plots do not yet suggest stall or failure.